18.2. Widget Basics
18.2.1. Widget Category
Motadata has following types of widgets available.
Metric Widget
The Metric widgets shows the following views in there widgets options and the user can create custom widget as per the needs.
Flow Widget
The flow widget are used to get data only for Flow related information.
Log Widget
The log widget are used to get data only for the log information.
Trap Widget
The trap widget are used to get the data only for the trap information (message floated by network devices).
Availability Widget
The widget checks the availability of networking devices.
Alert Widget
This widget displays all currently triggered alerts by default and allows you to acknowledge, mute alerts, or resume alerts inside the dashboard or reporting widget.
Health Widget
It shows all discovered devices’ health as per the monitor severity. Health widget has following gauge type visualization: Numeric and Tile.
Existing Widget
You may reuse the existing widgets like: metric, flow, log, availability, alert, health and views like: historical, top N/Least N, grid, and metric views.
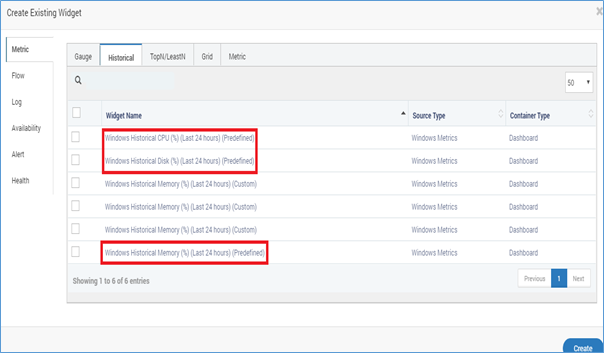
Existing Widget
Business Service
The Business service widgets showing information based on the created Business service data and the fired alerts on created Business service.
18.2.2. Widget Types
Widgets are of many shapes and size. How a widget looks depend on the type of the widget. A type of the widget is nothing but how the output is generated. You will find that Motadata shows widget types based on the category selected. On a high level note, the widgets are of following types:
Gauge: A gauge widget simply shows the count of the analytical data. Motadata uses information from last poll and show in this type of widget.
Historical: Historical widget shows the historical data of all the monitors in a given interval of time. This widget is generally used for comparison among different monitors.
TopN/LeastN: This widget shows the information of top and minimum performing monitors in a given interval of time. You can create graphs to quickly identify which monitors are consuming maximum resource.
Grid: This widget shows the information in form the grid. It’s a simple tabular format grouped by the monitors or event times.
List: When there is only one parameter, this widget shows the information in form the list.
Tree Map: The widget shows the information in form the hierarchy (tree).
Map: This widget shows the information in form of the google map. For this, you’ll need the Google Map’s API key first.
Chart: This widget shows the information in form the chart/graph.
Log: Shows the log/flow/trap messages in rows.
18.2.3. Widget Operations
You can select the widget and click on create to add on your Dashboard/Report on in Monitor Template:
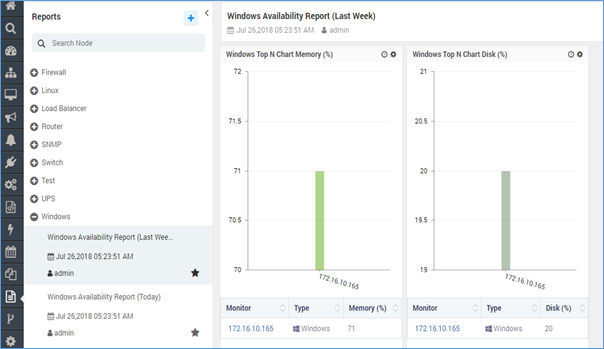
Widget for Report & Dashboard
You can apply widget property as well on predefined widget same as normal widgets and can export it into Excel, PDF:
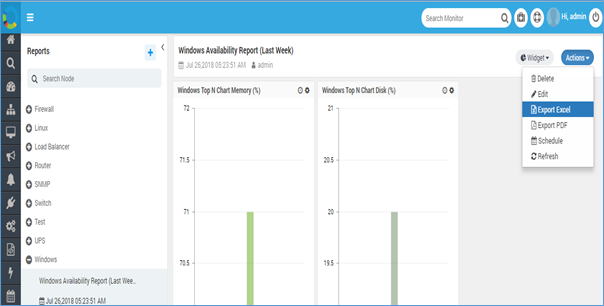
Export Widget Property to Excel and PDF
You can also download widgets in JPG/PNG format:
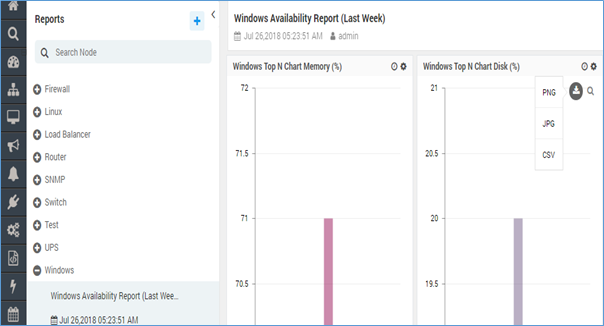
Download Widget UI as Image